Much has been written about the US shale gas phenomenon and the “fracking” technology which, according to popular opinion, is responsible for it. However, analysis shows that in reality another global phenomenon the high global oil prices, is responsible for what some call the US “shale gale”. Hydraulic fracturing or “fracking” technology has been in use since the 1980s, but only with the more recent increase the global crude prices did the “shale gale” blow.
By now everyone in the energy industry is probably tired of seeing some version of the graph in Figure 1 below, however some of my readers in different fields of pursuit may not have seen it or may not have seen it as often. The graph shows average market prices of energy for different hydrocarbon sources of primary energy. US DOE’s Energy Information Administration (EIA) is the source of the data. EIA’s data is in prices per unit of fuel. Fuels units are short tons of bituminous coal, barrels of West Texas Intermediate delivered to Cushing, Oklahoma, and thousand standard cubic feet of natural gas delivered to citigate or to an electrical power utility (typically a low cost buyer). These units were converted to average thermal energy they provide upon combustion. The resulting prices for thermal energy (in this case in millions of BTU) are shown in Figure 1.
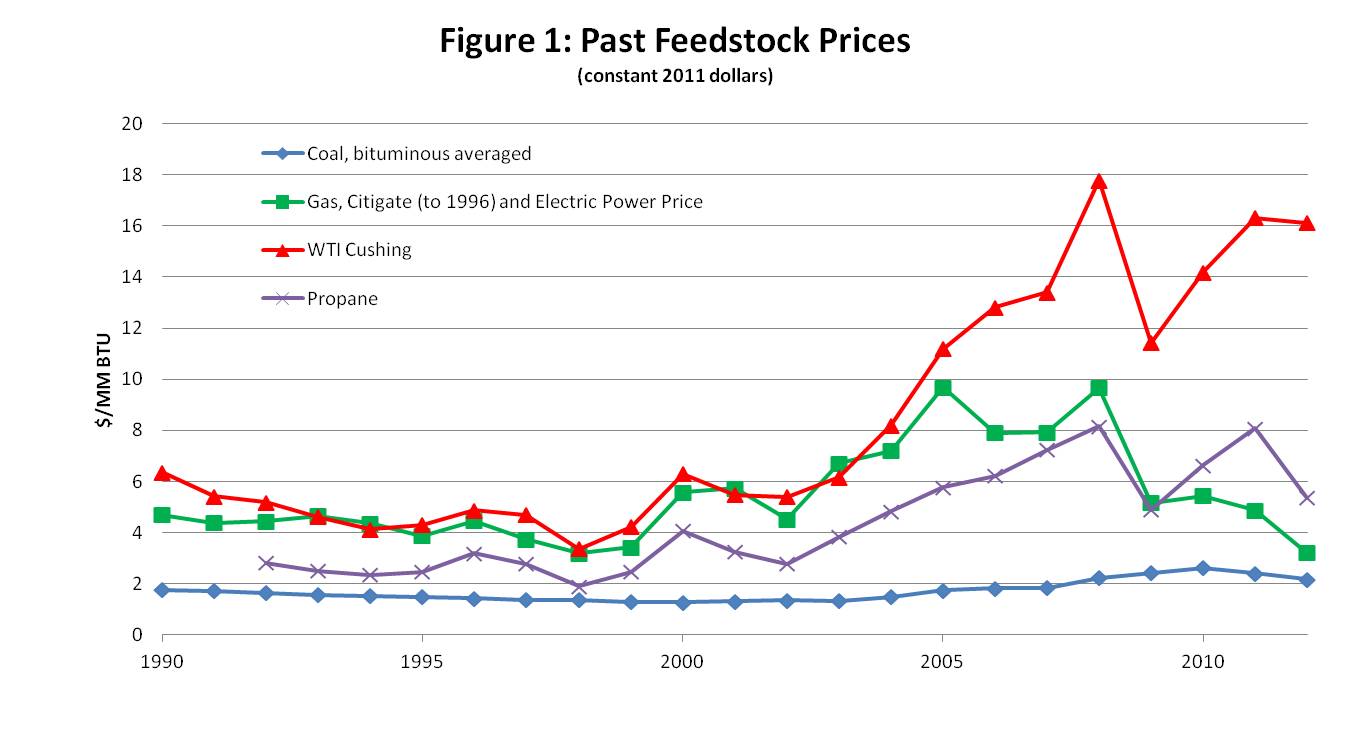
Source: Energy Information Administration, October 2012, North American prices
Review of the graph shows that prior to mid-2000’s energy prices trended together. Oil (as represented by West Texas Intermediate) was roughly the same price as natural gas (perhaps just slightly higher at times) on thermal energy basis, while coal was somewhat lower, but parallel to oil and gas. Coal, as a solid, is more difficult and more expensive to recover, transport and convert into energy as compared to the liquid oil or the gas and has always been discounted to incentivize the users. Propane, a by-product of natural gas production and usually sold as LPG, is a much smaller volume fuel. Although this graph goes back only to 1990, the relative price trends were the same for a long time prior. However, starting sometime around 2005, the prices of thermal energy from oil shot up and left the other forms of energy far behind. The question of why the oil prices shot up is another story. For now let’s just note that they did.
Shale or conventional natural gas may have different composition and characteristics when it comes out of the ground. It so happens that a number of shale gas plays in the United States produce what is known as “wet” gas, meaning that the gas is saturated with high content of liquid hydrocarbons known as natural gas liquids, or NGL. There is a range of natural gas liquids. The heaviest type is the so-called natural gasoline, which has very roughly similar composition as the gasoline we use in our cars. Natural gasoline is valued roughly about the same as crude oil. There is a range of lighter products similar to LPG the value of which spans the range between the crude and the natural gas prices. For example, propane, a heavy gas, starting at about 2010 is valued higher than natural gas but much lower than crude oil. The NGL content of produced natural gas in some shale gases ranges from 4 to 9 or maybe even higher gallons of NGL per one thousand standard cubic feet of natural gas. The math is simple. Let’s say 1000 standard cubic feet of produced shale gas brings up 5 gallons of liquids (at the lower end of the typical range of liquids content) with an average price of $40 per barrel (or about 40% of the crude oil price). $40 per barrel is approximately $1 per gallon, so just the liquids bring in $5 per standard cubic feet, which happens to be close to the current price of approximately $4 per million BTU. One of the nicest coincidences in the English system of units is that one: one thousand standard cubic feet of natural gas produces approximately one million BTU of thermal energy upon combustion. Natural gas and liquids together bring in $9 per million BTU.
The shale gas producers need all of that income. Hydraulic fracturing is expensive. Industry estimates that a breakeven price for shale gas produced via hydraulic fracturing is somewhere around $6 per one thousand standard cubic feet. That figure obviously varies widely depending on the particular characteristics of the production. What is also clear from our simple example is that the shale gas producer who produced the gas and liquids at $6 breakeven can sell the natural gas at $2 per million BTU and still cover his costs, although he would not have any money for reinvestment. It is also clear that if a shale play produces dry gas, the producer would lose money. There are a number of dry gas plays in the United States which are not being produced because the natural gas price is too low.
Thus although the “fracking” technology enabled the production of shale gas, US “shale gas phenomenon” would not be if:
1) US shales did not produce wet gas
2) High global prices of oil justified wet gas production.
It’s an interesting thing: the U.S. shale gas phenomenon is responsible for multibillion dollar investments in the United States manufacturing capacities leading some to proclaim the rebirth of U.S. manufacturing. “Insourcing”, Louisiana petrochemical construction boom, Texas Hill Country wineries, Houston housing boom, lucrative North Dakota salaries – all are the consequences of the “shale gale”. Yet all of that rests on the oily sheen of the high crude price bubble. How likely is that bubble to burst? Not very likely to burst very soon in my opinion, but that’s another story.

It was hard to find your website in google. I found it on 12 place,
you should build some quality backlinks , it will help you
to increase traffic. I know how to help you, just type in google – k2 seo tricks